Time-values profile plot for population simulations
Source:R/plot-population-time-profile.R
plotPopulationTimeProfile.RdTime-values profile plot for population simulations
Usage
plotPopulationTimeProfile(
  dataCombined,
  defaultPlotConfiguration = NULL,
  aggregation = "quantiles",
  quantiles = c(0.05, 0.5, 0.95),
  showLegendPerDataset = FALSE,
  ...
)
Arguments
- dataCombined
A single instance of
DataCombinedclass containing both observed and simulated datasets to be compared.- defaultPlotConfiguration
A
DefaultPlotConfigurationobject, which is anR6class object that defines plot properties.- aggregation
The type of the aggregation of individual data. One of
quantiles(Default),arithmeticorgeometric(full list inospsuite::DataAggregationMethods). Will replaceyValuesby the median, arithmetic or geometric average and add a set of upper and lower bounds (yValuesLowerandyValuesHigher).- quantiles
A numerical vector with quantile values (Default:
c(0.05, 0.50, 0.95)) to be plotted. Ignored ifaggregationis notquantiles.- showLegendPerDataset
Logical flag to display separate legend entries for observed and simulated datasets, if available. This is experimental and may not work reliably when both observed and simulated datasets > 1. Defaults to
FALSE.- ...
additionnal arguments to pass to
.extractAggregatedSimulatedData()
Details
The simulated values will be aggregated across individuals for each time point.
For aggregation = quantiles (default), the quantile values defined in the
argument quantiles will be used. In the profile plot, the middle value
will be used to draw a line, while the lower and upper values will be used
as the lower und upper ranges. For aggregation = arithmetic, arithmetic
mean with arithmetic standard deviation (SD) will be plotted. Use the
optional parameter nsd to change the number of SD to plot above and below
the mean. For aggregation = geometric, geometric mean with geometric
standard deviation (SD) will be plotted. Use the optional parameter nsd to
change the number of SD to plot above and below the mean.
Examples
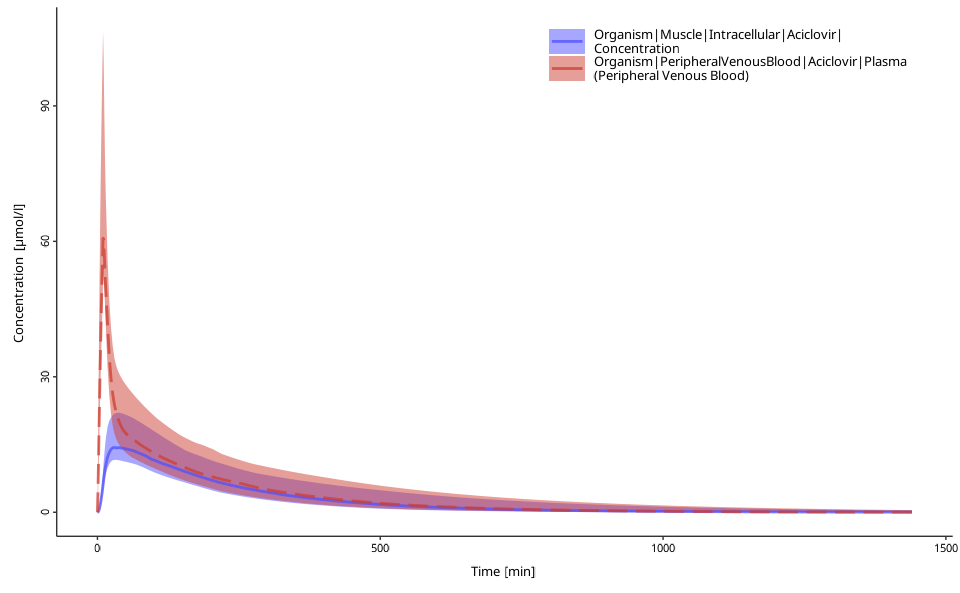
simFilePath <- system.file("extdata", "Aciclovir.pkml", package = "ospsuite")
sim <- loadSimulation(simFilePath)
populationResults <- importResultsFromCSV(
simulation = sim,
filePaths = system.file("extdata", "SimResults_pop.csv", package = "ospsuite")
)
# Create a new instance of `DataCombined` class
myDataComb <- DataCombined$new()
myDataComb$addSimulationResults(populationResults)
# plot
plotPopulationTimeProfile(myDataComb)
 # plot with other quantiles
plotPopulationTimeProfile(myDataComb, quantiles = c(0.1, 0.5, 0.9))
# plot with other quantiles
plotPopulationTimeProfile(myDataComb, quantiles = c(0.1, 0.5, 0.9))
 # plot with arithmetic mean
plotPopulationTimeProfile(myDataComb,
aggregation = "arithmetic"
)
# plot with arithmetic mean
plotPopulationTimeProfile(myDataComb,
aggregation = "arithmetic"
)
